Santa's little (index) helper
Santa's little (index) helper
Getting a little unexpected help is always nice.
This was the case for me when I was tasked with troubleshooting a slow web application that had already received user complaints. Moreover there will be a significant increase in data in the future.
As I started working on this issue, I quickly discovered that a significant amount of the application's response time was spent in an Oracle Database.
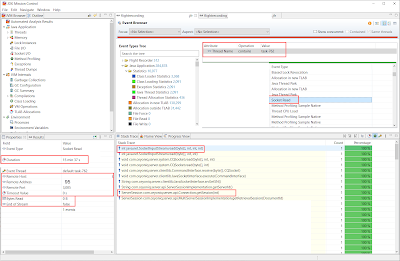
This was revealed when analyzing a Java Flight Recording of the app (Socket Reads)
I used dashtop by Tanel Poder to investigate which Statements where slow in the past 14 days:
@D:\tpt-oracle-scripts\ash\dashtop sql_id,sql_plan_operation,sql_plan_options  username='MYSCHEMA' sysdate-14 sysdate
    Total
  Seconds     AAS %This SQL_ID        SQL_PLAN_OPERATION    SQL_PLAN_OPTIONS            FIRST_SEEN          LAST_SEEN
--------- ------- ----- ------------- --------------------- --------------------------- ------------------- -------------------
     6540      .0   36% 1f5jftdg1yddg TABLE ACCESS          FULL                        2023-02-06 06:39:06 2023-02-13 06:56:42
     4400      .0   24% avx5a4xgw1pdy HASH JOIN                                         2023-02-06 07:17:51 2023-02-10 18:01:41
     2930      .0   16% 4rhf5f97hh666 TABLE ACCESS          FULL                        2023-02-06 06:47:38 2023-02-10 16:24:24
      830      .0    5% avx5a4xgw1pdy TABLE ACCESS          FULL                        2023-02-06 07:49:25 2023-02-10 15:57:37
      650      .0    4% 2yz69huy5xdu2 TABLE ACCESS          FULL                        2023-02-06 07:01:38 2023-02-10 15:38:30
      380      .0    2% bds7syfuff0k6 TABLE ACCESS          FULL                        2023-02-06 07:34:34 2023-02-10 16:28:00
      170      .0    1% 22116p9bzas0s TABLE ACCESS          FULL                        2023-02-06 08:34:39 2023-02-10 12:52:16
...
The script shows that the top statements were mostly doing Full Table Scans, which was strange for an application outputting only few lines when a user interacts with it.
This led me to believe that some indexes might be missing.
In order to find proof I would have to analyze various factors such as execution statistics from AWR, plan cardinalities, filter/access predicates, the amount of rows returned in past executions, and table sizes.
A tedious process, especially since I'm not familiar with the underlying data schema.
Thinking about how to approach this situation I remembered a tweet by Tanel three years ago:
Ok, let's have some friday evening fun. Ask "Is there a script for..." (whatever Oracle stuff you have in mind) and I'll see if I already have one!
— 0xTanelPoder 🇺🇦 (@TanelPoder) October 4, 2019
Challenge accepted!
Instead of asking him directly I tried his script search function to look for scripts regarding indexes :
@D:\tpt-oracle-scripts\help index;
NAME                      DESCRIPTION                                                  USAGE
------------------------- ------------------------------------------------------------ -------------------------------------------------------------------------------------------
ash_index_helper.sql      Santa's Little (Index) Helper BETA                           @ash/ash_index_helper <sql_id> [<owner>.]<table_name> <from_time> <to_time>
                                                                                       @ash/ash_index_helper 8zz6y2yzdqjp0 %.% sysdate-1/24 sysdate
                                                                                       @ash/ash_index_helper % TPCDS.% sysdate-1/24 sysdate

ind.sql                   Display indexes                                              @ind [<owner>.]<index_name|table_name>
                                                                                       @ind orders
                                                                                       @ind soe.ord_customer_ix
                                                                                       @ind soe.%

indf.sql                  Display function-based index expressions                     @indf [<owner>.]<index_name|table_name>
                                                                                       @indf orders
                                                                                       @indf soe.ord_customer_ix
                                                                                       @indf soe.%
Hmm. ash_index_helper sounds interesting. Let's give it a try:
@D:\tpt-oracle-scripts\ash\ash_index_helper % MYSCHEMA.%  sysdate-1 sysdate

-- I'm interested in every Statement that took place in the schema of the webapp in the past 24 hours

-- Santa's Little (Index) Helper BETA v0.5 - by Tanel Poder ( https://tanelpoder.com )

   SECONDS     AAS CPU   WAIT  Accessed_Table   Plan_Operation                           PLAN_CARD TABLE_ROWS FILTER_PCT  SQL_EXECS ELA_SEC/EXEC PREDICATES                                      DIST_SQLIDS DIST_PLANS MIN(AP.SQL_ID MAX(AP.SQL_ID
---------- ------- ----- ----- ---------------- --------------------------------------- ---------- ---------- ---------- ---------- ------------ ------------------------------------------------ ----------- ---------- ------------- -------------
       582      .0  35%   65%  MYSCHEMA.TAB_A       TABLE ACCESS FULL [MYSCHEMA.TAB_A]      323296    6465922 4,99999845         95        6.212  [F:] LOWER("AUFTRAG") LIKE LOWER(:1)                     1          1 1f5jftdg1yddg 1f5jftdg1yddg
       153      .0  98%    2%  MYSCHEMA.TAB_B       TABLE ACCESS FULL [MYSCHEMA.TAB_B]          12      68731 ,017459370       4136        0.040  [F:] (LOWER("SVNURL") LIKE :1                            1          1 4rhf5f97hh666 4rhf5f97hh666
        80      .0  41%   59%  MYSCHEMA.TAB_C       TABLE ACCESS FULL [MYSCHEMA.TAB_C]       50267    1005341 4,99999503        185        0.429  [F:] LOWER("TAB_C"."AUFTRAG") LIKE LOWER(:1)             1          1 2yz69huy5xdu2 2yz69huy5xdu2
...
Excellent! The script uses ASH to identify the most expensive plan steps within the specified timeframe.
Moreover, it calculates FILTER_PCT, which represents the proportion of the table that might be returned by the plan step. This is achieved by dividing the cardinality estimated by the optimizer for this step by the number of table rows and then multiplying it by 100.
Additionally, it provides information about the SQL execution frequency (SQL_EXECS), the number of individual plans linked with the SQL (DIST_PLANS), and the historical execution time of the SQL (ELA_SEC/EXEC).
The first line displays data related to the most expensive statement I encountered in dashtop (SQLDID: 1f5jftdg1yddg). This plan step retrieves roughly 5% of the table rows using the "LOWER("AUFTRAG")" filter predicate. There is only one SQL (DIST_SQLIDS) and one plan (DIST_PLANS) associated with this plan step and predicate. All things considered, indexing MYSCHEMA.TAB_A (lower(auftrag)) could be a useful optimization.
This way, I was able to deploy some helpful indexes easily in a fraction of the time it would have taken me otherwise.
Thank you, Tanel, for the unexpected help!
It would be great if there was a version of the script that utilizes AWR as a source, rather than ASH. Since Oracle 20c, the database stores the predicates not only in ASH but also in AWR:
20c-awr-now-stores-explain-plan-predicates
As a result, it would be possible to do analyses over a more extensive time frame.
The mentioned scripts and other useful ones can be found on Tanel's GitHub repository: https://github.com/tanelpoder/tpt-oracle.

Comments
Post a Comment